2025 Market Outlook
Jan 18, 2025
The markets have already entered 2025 with noticable volatility. Let's explore what's ahead of us in the coming months.

Kacper Tomasiak

Web & SEO Manager at Swapped.com
The new year of 2025 has just started, but the market is already making moves. With so many catalysts, it’s difficult to infer how the market will behave and assess any changes in your portfolio accordingly. Every little detail is a piece of a larger puzzle, and the future remains unknown. The labor market is tight, which implies the economy is strong. On the other hand, the uninversion of the yield curve suggests that a great turmoil lies ahead.
Considering that we receive contradictory signals from everywhere, is predicting the future even a viable option? Finally, what really awaits us in 2025—will we experience a face-melting rally, or is a devastating recession ahead of us? Let me shed some light on the matter.
Crypto fundamentals
Cryptocurrencies are highly dependent on the traditional markets. It is tough to imagine a scenario where stocks go down, but Bitcoin continues to grind higher. Until Bitcoin stops trading as a risk asset, it will be considered as one.
Bitcoin dominance
Bitcoin dominance has been continuously going up since late 2022. Although it serves as a meaningful indicator in the crypto space, it has been dismissed many times. In essence, Bitcoin dominance shows the rotation of capital and where the money is actually going. The higher the Bitcoin dominance is, the more attractive altcoins become. It hit the 60% mark in November 2024 and was unable to get above it since then.
Altcoin season
The altcoin season index is directly correlated with the Bitcoin dominance. It is a useful tool to understand what part of the four-year cycle we are in. Altcoin valuations against Bitcoin were at all-time lows in some cases. 2025 is the post-halving year, and this is when altcoins give phenomenal returns. Will it be different this time?
Bitcoin has been in a strong uptrend since it bottomed out in November 2022. Taking into account other market cycles, we are a lot higher than we would normally be. Bitcoin spot ETFs have distorted the image of a normal 4-year Bitcoin cycle. Using the CBBI index, which contains several different indicators, has been an accurate signal for both fear and euphoria phases. Although the rules have changed how some of these indicators are calculated, CBBI still remains a valuable sign of over- and undervaluation.
Hash rate
Bitcoin hash rate is the total computational power participating in the network consensus and is at historically high levels. This means the Bitcoin network is secure and miners have the conviction as well as the financial incentive to continue supporting the network. The higher the Bitcoin hash rate climbs, the more decentralized the network is and the higher the mining difficulty is.
TVL in DeFi
TVL stands for Total Value Locked and is an indicator of how much money is locked across various protocols on a network. As the TVL rises, more liquidity is available for DeFi related activities, which makes it easy for users to truly enjoy the protocol. Increased TVL is what contributed to the success of networks such as Ethereum or Solana.
Stablecoin growth
Stablecoins are tokens that hold stable value and are pegged to a real-world asset, usually the US dollar. Their goal is to maintain value during uncertain times and serve as a volatility hedge. The combined market cap of all stablecoins is sitting at just over $180 billion dollars. Stablecoins act similarly to money supply in an economy, but on a micro scale. All the liquidity that’s available starts flowing into different cryptocurrencies raising their prices and with Tether printing billions of USDT, the bullish trend is with us.
Crypto regulations
With the new year of 2025, MiCA regulations were introduced in the entire EU, which aim to regulate the use of digital assets and prevent fraudulent use such as money laundering. Countries around the world are now waking up and embracing crypto, instead of fighting it. Donald Trump has announced the United States of America will have crystal clear rules for cryptocurrencies. His goal is to bring innovation back to the US, and the Trump administration is admittedly rumored to favor US-based cryptocurrencies. All these events are bullish catalysts for the crypto market, and if everything goes as planned, more liquidity will start to flow in.
Since Bitcoin was created, it started gaining momentum, but it wasn’t until a few years ago that it started being treated seriously. With the adoption of the Bitcoin standard by Microstrategy in August 2020 and El Salvador becoming the first country to recognize Bitcoin as an official currency, big players started noticing the trend. As of now, countries around the world are planning national Bitcoin reserves. Many countries, like the UK, the US, or China, already own some BTC seized from illegal or suspicious activities. Countries are now joining the race to accumulate the ultimate asset.
Yield curve
The yield curve is a very talked-about topic as a sign of an upcoming recession. Many inexperienced investors make the mistake of selling their stocks or crypto when the yield curve ventures into negative values. While this is an indication that something may be wrong with the economy, the period of positive returns lasts a bit longer. It is when the yield curve uninverts that you should stay cautious and reassess your cash position.
In simple terms, the yield curve is a graphical representation of relationships between long-term and short-term US Treasuries. In the case of the yield curve, it is the yield of 10-year bonds subtracted by the yield a 2-year bond generates. In this context, maturity is the length of time before the amount is repaid with interest. In normal market conditions, the longer you lock your money for, the more you gain, which is why most of the time more mature treasury bonds pay more interest. However, this is not always the case. When the yield curve is uninverted, 2-year bonds actually have a higher yield.
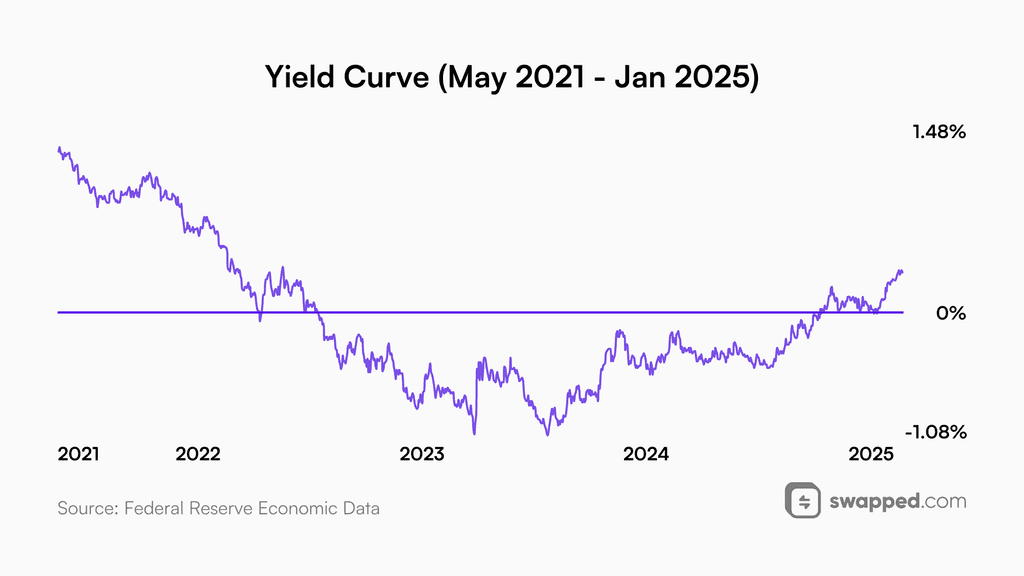
Most of the time, when the yield curve uninverts, a recession follows within a short period of time. Data source
Sticky inflation
Despite the fact that great progress has been made with combating inflation, it has still not returned to its previous levels and continues to hover at around 3%.
What is inflation?
Inflation is the rate at which the prices of goods and services grow over time. The inflation rate represents the loss of purchasing power of fiat money. In other words, each dollar buys you less. Traditional currencies are designed to be inflationary, which encourages the consumer to spend money, thus fostering growth. The rate of inflation is typically measured by the Consumer Price Index (CPI).
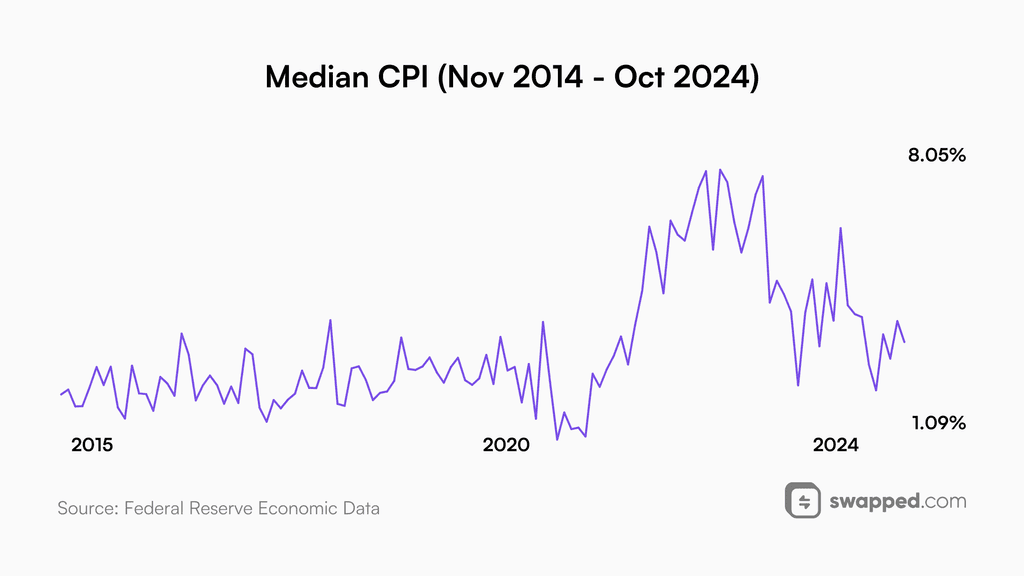
Inflation has been hovering around the 3% mark for some time. Data source
Why is it persistent?
There are many reasons why inflation is so sticky. We now live in extraordinary times, where there is so much money in circulation that it becomes challenging to decrease the liquidity without causing systemic risk. After the pandemic started and we witnessed the crash of March 2020, the Fed printed trillions of dollars and distributed stimulus checks in an attempt to help consumers and, more importantly, support the prices of equities. As effective as it was, it led to a prolonged period of inflation. Additionally, the labor market remains tight with a very low unemployment rate. Moreover, high energy prices, especially gas and oil, have significantly contributed to inflation’s current state. Although they have indeed come down from their respective peaks, a long way is ahead of us to see them at sustainable levels.
The worst-case scenario for the stock market is the renewed inflation surge. I don’t desire to be so pessimistic, but if this were to occur, the next few years could truly be called “The Lost Decade”—it would be the 1980s all over again. While this is very unlikely to happen as of now, continuous monitoring of the situation is required as changes can escalate quickly.
Interest rates
Although interest rates are not at their peak, the future remains uncertain. They are very likely to go down in 2025—just not as quickly as investors expect.
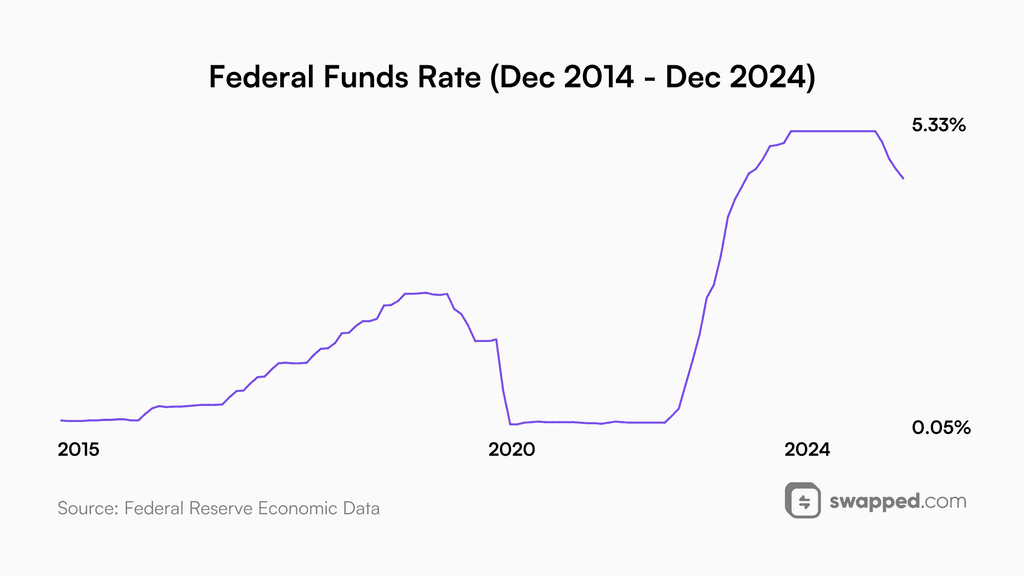
Interest rates are in a downtrend but won’t go down as quickly as investors expect. Data source
Interest rates are set by central banks and refer to the rates at which commercial banks can borrow money from the central bank. They are a benchmark, and everything is based on or derived from them, starting from loans and ending with yield on a savings account. Interest rates are a powerful tool to steer the economy—they dictate whether it is worth it to spend money or save.
Since the peak in July 2023, the Federal Reserve has cut interest rates three times. In December 2024, the Fed announced that investors should expect fewer cuts in 2025. This is mainly caused by inflation hovering around 3%. While the trend of interest rates is clear, we should ask ourselves when interest rates stop being a headwind for risk assets. Then there is also a possibility of interest rates going up as inflation surges. While unlikely, such a risk exists.
Hawkish Federal Reserve
The Federal Reserve has the power to let the economy prosper or crash it. Even with so many tools at their disposal, it’s a balancing act trying to get inflation down without causing a recession. There are talks of a soft landing, but is it even possible?
The Federal Reserve is the central bank of the United States. Established in 1913, it plays a crucial role in the US economy. Their role is to regulate banks, manage the money supply, and provide financial services to the government. In simple terms, they buy the government’s debt with freshly printed money. It is worth noting that in contrast to other central banks, the Fed is a private company the government has very little authority over.
How the Fed works
The main goal of the Fed is to have a stable and expanding economy. In short, the Fed has two modes: they either stimulate the economy or cool it down. When inflation is rising, they make borrowing more expensive by raising interest rates and put downward pressure on equities by reducing their balance sheet, thus taking money out of circulation. When a recession materializes, the Federal Reserve lowers interest rates sharply and prints money by purchasing government-issued bonds.
A soft landing is an ideal solution to the problem of inflation. The idea is to slow down the economy without crashing the prices of assets and avoiding a recession. In an ideal scenario, the economy slows down gradually rather than turning into a crisis with widespread unemployment, bankruptcies, and lack or even negative growth.
P/E ratios
Price-to-earnings ratios differ all over the world. While stocks in the United States may seem overpriced, Brazilian companies are cheaper than ever. Is it even justified?
What is a P/E ratio?
P/E ratio refers to the price of a stock divided by the earnings per share (EPS). If a P/E ratio is 10, it says that the company is valued at 10 years of its current earnings. This metric is used to tell how expensive or cheap a company or stock market in general is. In many countries like Brazil or the UK, these ratios are lower than 10, but in the US they are in the range of 25 to 35, and some tech companies are so expensive relative to the market that the ratio is north of 100.
Yes and no. Typically, P/E should oscillate around 8-10, but in the case of the US it has always been far from it. The United States has the largest stock market on earth, and money is literally pouring into the capital markets everywhere. Inflows to the US are 4 times that of the EU. This is caused by a multitude of factors, but most important are fewer regulations and more innovation. The high prices may be justified because of the potential that lies in American shares. Especially tech stocks have been beating every earnings estimate, and if it continues, the high price-to-earnings ratio is a symbol of a bet on the US stock market. Does it work as of now? Yes. Is it sustainable in the long run? Absolutely not.
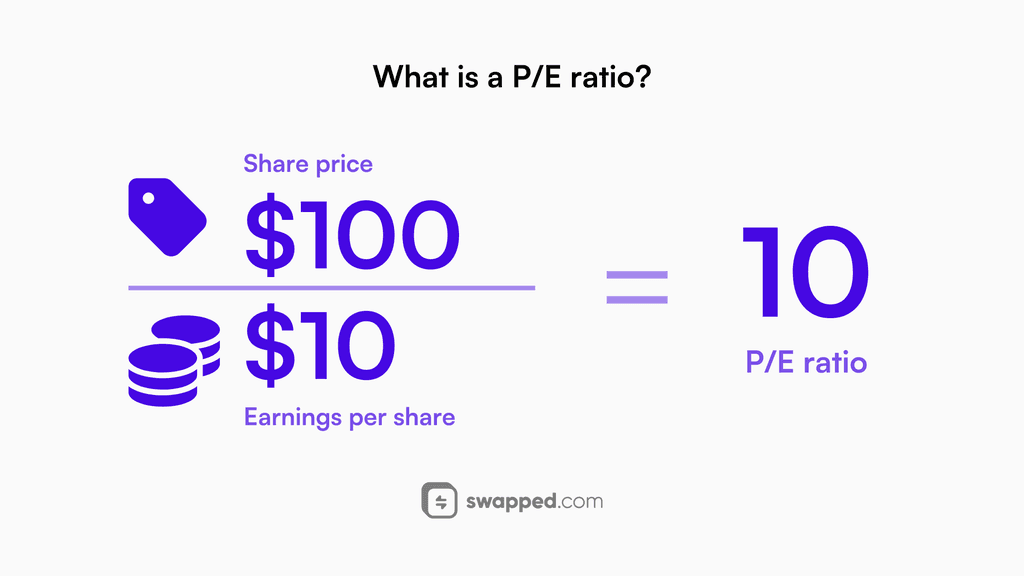
P/E ratio is the share price divided by earnings per share (EPS).
Global liquidity
The market tends to move along with the money supply—both to the upside and downside.
Global liquidity refers to all the money that is available in the system across all the countries. It is calculated by adding the balance sheets of all central banks. Since it’s measured in US dollars, all the currencies are converted into the world’s reserve currency.
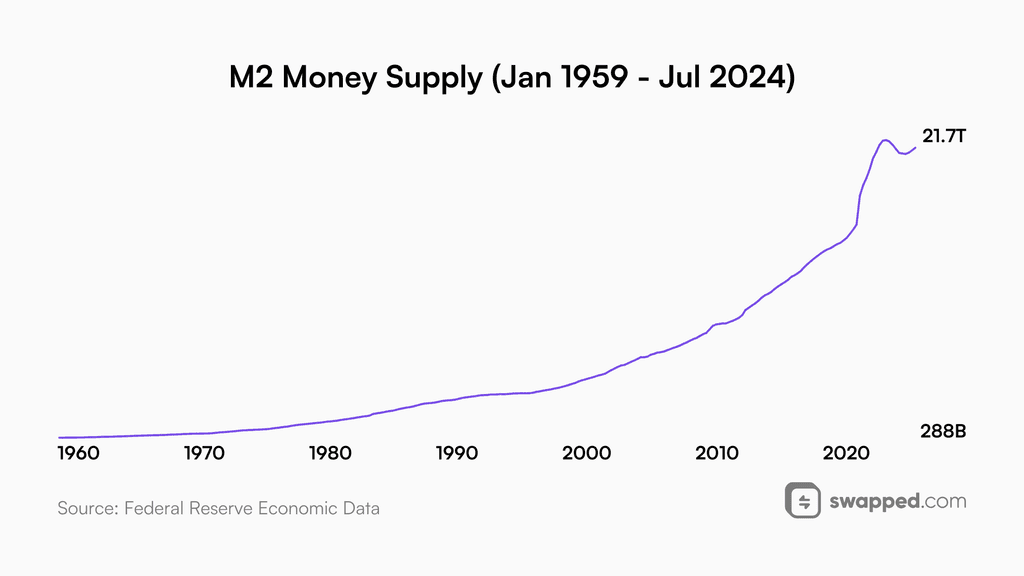
The markets follow the money supply on a long enough time horizon. Data source
Global liquidity directly shapes the charts. While some companies or cryptocurrencies may go against the trend because of good or bad news, such a move is usually short-lived. Global liquidity is the effect of the combined monetary policies of central banks, with the Fed being the most important. All the liquidity available tells us if the world is in the contraction or expansion phase. This is very important, because just by simply tracking global liquidity, an individual can understand the trend and market conditions. In the long run, liquidity goes up and currency debasement continues. The entire world is reliant on debt that we will never repay, but by keeping the inflation at controllable levels, the governments ensure that servicing the debt is manageable.
Carry trade
Japan has been in a stagnation for over 40 years, seeing minimal growth. To avoid a recession, the interest rates have been kept below zero by the Bank of Japan (BoJ). With the Nikkei 225 piercing all-time highs, it all starts to change, and with it the upcoming risk approaches.
Carry trade is a strategy or a common occurrence to borrow money in a low-interest currency and use the capital to buy appreciating assets. As an example, let’s say you borrow $1 million worth of Japanese yen (JPY) at an interest rate of around 2%. You then proceed to invest the money in the prospering US stock market. At first everything goes smoothly, but as Japan hikes interest rates, your profit margins decrease. A turnaround in the market is what you expect the least, and when it happens, you’re underwater because your investments plummeted, and as more traders who followed the same strategy start to liquidate their positions, the Japanese yen rises. Before you know it, you are forced to sell your positions at a loss and are left with less than you had.
The total worth of carry trade is in the hundreds of billions or even trillions of dollars. What happened in August 2024 when BoJ raised interest rates by 25 basis points? Both Nasdaq and Nikkei dropped more than 10% within a span of a few days as traders began to liquidate their positions. Now imagine that this could be just a foretaste of what could come. While not extremely likely, we can’t rule out a large liquidation event caused by appreciation of yen and depreciation of equities.
The weaker the yen, the more money is flowing out of Japan to foreign markets.
Wars and global conflicts have always had an impact on asset price behavior. Considering there are two major conflicts at the time of writing, their resolution will likely suggest the next market move.
The war in Ukraine
The war in Ukraine, which began in February 2022, is the result of a conflict of interests between Russia and Ukraine. Russian president Vladimir Putin launched an attack, claiming to protect Russian-speaking people in Ukraine and preventing Ukraine from joining NATO. The war has had a great impact, initiating humanitarian help for civilians and western countries opening up for refugees. Although there have been attempts to end the conflict, sadly with no success, the US election results may reshape the world as we know it. Donald Trump will be inaugurated on January 20 and promised to end the conflict. Moscow responded that they were eager to negotiate. Bringing peace may stabilize the markets and bring bullishness back.
Despite many conflicts taking place at the same time in this region, one stands out. The conflict between Israel and Palestine has been going on for years, but it was reignited with Hamas’ attack on October 7, 2023. Since then, Israel has been ruthlessly fighting both Hamas and Hezbollah, even on territories of other countries like Lebanon. The prime minister of Israel, Benjamin Netanyahu, has also been accused of committing human atrocities and genocide on Palestinians. President Trump also reiterated he would stop the conflict as soon as he was in power.
Market cycles
Different assets operate on different cycles. Cycles dictate the seasonality of an asset most of the time. Where are we now? Time for a reality check.
A market cycle is the fluctuation of an asset’s price over time. It’s a repeated pattern of expansion and contraction phases. Market cycles are mostly driven by economic activity, investor behaviors, and other events. Sometimes, a cycle may be considered failed or incomplete because of an event that turns everything upside down—a black swan.
A black swan is a term used to describe an unexpected and unanticipated event that has a vast impact on the broad market. They have the power to disrupt the system and are usually mentioned when it comes to the downside risks. The term is slightly overused, as investors seem to call every event a black swan nowadays. Can you really predict the unpredictable?
It’s difficult to estimate where in the grand scheme of things we are located. The S&P 500 index is trading close to all-time highs, and so is Nasdaq. If we void the March 2020 crash, the last recession we had was the financial crisis of ‘08. Since then, we’ve been in a constant period of economic expansion and stimulation. This poses a serious question of whether the current growth is sustainable and the economy is as strong as we think. Bearish investors have been predicting a recession to happen for years, yet the market is piercing new highs. Ultimately, one remains clear: a catharsis has to come at some point for the stupid money to vanish.
A famous quote by Peter Lynch gets to the point.
Labor market
The labor market is the foundation of today’s economy. The unemployment rate has always remained low when the economy was booming and went up during financial crises. Does it signal that we should start worrying?
Despite the work the Fed has done, the labor market still remains tight. While true, the unemployment rate has increased slightly; it is nowhere near elevated levels. There are many speculations regarding this topic, one of which is that a lot of workers in the US are working a few part-time jobs. It may be correct, but most likely the demand for workers and still high economic activity is the reason. The labor market is putting inflationary pressure on the economy, but at the same time propping the economy up and preventing a recession. It’s worth noting, however, that when something breaks, the labor market accelerates to the upside and is a sign of a looming recession.
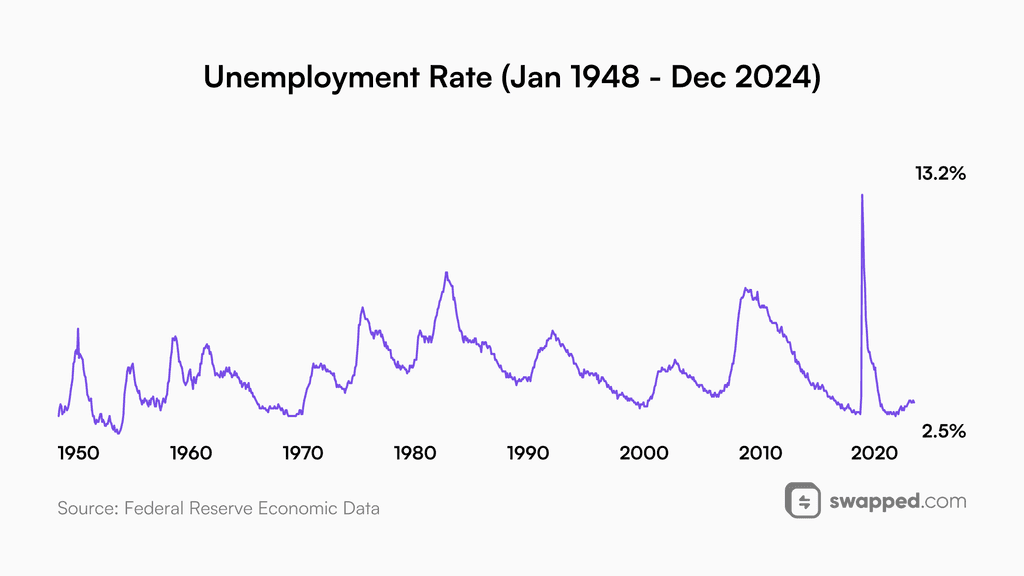
The unemployment rate is a great indicator of economic health and activity. Data source
US election
November 2024 left many surprised with the final result of the US elections. Kamala Harris was supported by nearly every mainstream media station, and yet she lost. Donald Trump leveraged the power of social media to win. Perhaps it was the reluctance towards another four-year term of a Democratic president or possibly the iconic survival of Donald Trump during his assassination attempt and his anti-establishment stance or promises.
The numbers don’t lie, and although the Covid crash happened during Trump’s term, the markets quickly recovered. The economy seems to favor Trump over Biden or any other Democratic presidents. Inflation rate, stock market growth, unemployment rate—you name it, which is why Donald Trump ruling the United States again is a factor worth taking into account. This is precisely why the market sentiment has been bullish for the past months and may continue to be.
Weaker economy
The Biden administration has been successfully misleading the general public regarding the shape of the economy. Although Trump’s power takeover is extremely bullish for the markets, dealing with the consequences of raising interest rates too late may be harder than expected. The US economy, as strong as it looks, isn’t what it seems on the surface. There are many dangers ahead, like the unemployment rate skyrocketing, the second wave of inflation, or interest rates staying elevated for too long.
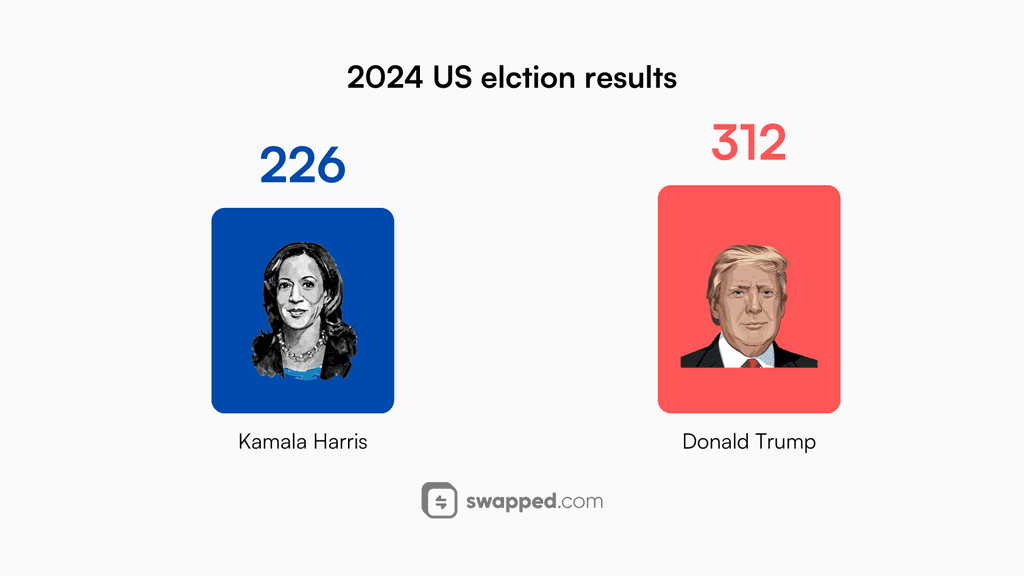
Trump’s win in the US elections marks a turning point for the markets.
A bullish continuation or a bearish reversal?
Although many indicators suggest a recession, a lot may change in the coming months or even weeks. Factors such as an end to wars and inflation cooling down may keep the bullish momentum going for long. The best portfolio is prepared for all scenarios, which is why I always iterate to be exposed to the upside while minimizing the risk to the downside. Keeping a certain allocation in the market while adjusting your cash position depending on stock valuations, unemployment rate, and interest rates is the best way to make money but also not lose a fortune when the inevitable happens.
This article is for educational purposes only and should not be interpreted as financial advice.